Introduction
Podophyllotoxin (PPT) is an antitubulin agent that leads to blockage of cell reproduction and apoptosis of the cell. It is also not a substrate for P-gp, unlike epi-podophyllotoxins such as etoposides. Unfortunately, it suffers from low solubility and little selectivity like many other antineoplastic drugs. When attempted for clinical trials for cancer, PPT therapy lead to severe gastrointestinal adverse effects. Currently, PPT is only used topically for warts.
With NanoCMC technology, we developed a nanoparticle dosage form of PPT by covalently conjugating PPT and polyethylene glycol (PEG) with acetylated carboxymethyl cellulose (CMC-Ac) using one-pot esterification chemistry. This formulation forms ultra-small nanoparticles which have demonstrated antitumor efficacy, even against multi-drug resistant tumors due to P-gp upregulation, and greatly enhanced safety profile with no significant side effects. (Yang et al., 2017: https://www.ncbi.nlm.nih.gov/pubmed/27873118)
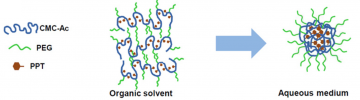
Fig 1. Image describing the basic structure behind the Celludo-PPT formulation. Image from Roy et al. Biomaterials 2015;52:335-346. doi:10.1016/j.biomaterials.2015.02.041.
Composition Optimization
This formulation has the ability to self-assemble when placed in a solution, with hydrophobic drug aggregating into a core. Interestingly, as the amount of hydrophobic drug, PPT, was increased, the conjugate would assemble into a larger particle due to increased amount of drug in the internal core. Further, as the amount of PPT continued to increase, secondary and tertiary structures could form leading to further stabilization of the hydrophobic internal core. (Yang et al., 2017: https://www.ncbi.nlm.nih.gov/pubmed/27873118)
These effects cause to observe changes in not only size, but also in release profile and antitumor efficacy (including cell killing potency and tumor delivery) depending on the composition of the nanoparticle. Antitumor efficacy and comparison is talked about under its respective heading.
Size and Release Profile
A PPT/PEG molar ratio of 2 lead to formation of nanoparticles of 20nm size. PPT was released at approximately 5% per day in serum. A PPT/PEG ratio of 5 and 20 produced nanoparticles the size of 30nm and 120nm, respectively. PPT was released at approximately 2.5% and 1% per day, respectively. (Yang et al., 2017: https://www.ncbi.nlm.nih.gov/pubmed/27873118)
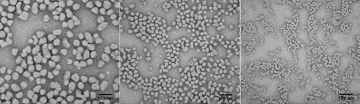
Fig 2. Image of size difference of nanoparticles with different PPT/PEG ratios. On the left is a ratio of 20, in the middle a ratio of 5 and on the right a ratio of 2. PPT/PEG ratio of 2 produced smallest-sized nanoparticle. Image from Roy et al. Biomaterials 2015;52:335-346. doi:10.1016/j.biomaterials.2015.02.041.
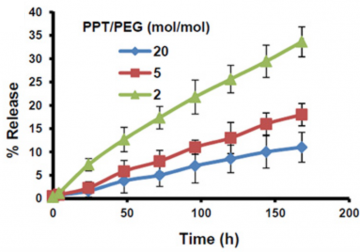
Fig 3. Comparison between release profile for different PPT/PEG ratios. Nanoparticles with higher PPT/PEG ratio had slower release profiles. Image from Roy et al. Biomaterials 2015;52:335-346. doi:10.1016/j.biomaterials.2015.02.041.
Cell Killing Potency and Tumor Delivery
A PPT/PEG molar ratio of 2 lead to 2-5 fold higher cell killing potency and 5-20 fold increased tumor delivery compared to the larger nanoparticles consisting of PPT/PEG ratios of 5 and 20.
The 20nm particle showed 8-fold higher distribution to the tumor compared to other tissues while larger nanoparticles also showed higher accumulation in liver during the biodistribution study. During the microdistribution study, the 20nm nanoparticle was able to enter the hypovascular region (>90%) while the larger nanoparticles remained mostly in the hypervascular region (the periphery). (Yang et al., 2017: https://www.ncbi.nlm.nih.gov/pubmed/27873118)
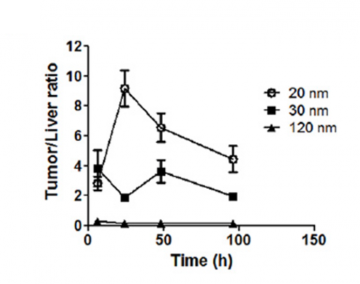
Fig 4. The distribution ratio between the different sized Celludo-PPT nanoparticles is shown in a biodistribution study. 20nm Celludo-PPT nanoparticles with a PPT/PEG molar ratio of 2 displayed highest tumor selectivity. Image from Roy et al. Biomaterials 2015;52:335-346. doi:10.1016/j.biomaterials.2015.02.041.
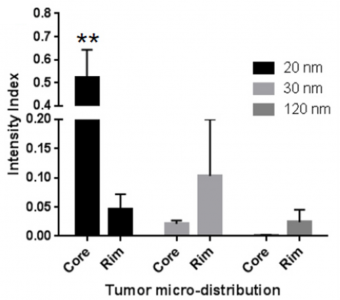 Fig 5. The relative microdistribution between the core and the rim is shown. 20nm Celludo-PPT nanoparticles with a PPT/PEG molar ratio of 2 showed highest penetration into core of tumor. Image from Roy et al. Biomaterials 2015;52:335-346. doi:10.1016/j.biomaterials.2015.02.041.
Antitumor Efficacy and Safety
The 2:1 PPT/PEG molar ratio formulation showed superior efficacy against MDR tumor models (EMT-6-AR1 murine breast tumor, PC3-RES human prostate tumor) compared to larger Celludo-PPT nanoparticles, free PPT and standard taxane therapies. Mice were able to tolerate Celludo-PPT doses up to 180mg PPT/kg (3 i.v. doses) and did not experience significant body weight loss or discomfort. Free PPT groups began experiencing significant side effects at 20mg PPT/kg (single dose) with 2 of the 10 reached humane endpoints. (Yang et al., 2017: https://www.ncbi.nlm.nih.gov/pubmed/27873118)
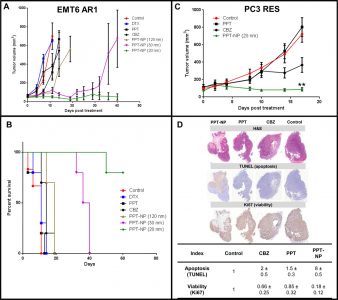
Fig 6. In vivo efficacy data is shown with EMT6 AR1 and PC3 RES. Celludo-PPT nanoparticles of 20nm size showed superior efficacy to larger sized nanoparticles as well as free CBZ or PPT in terms of tumor volume reduction and (for the EMT6 AR1 model) percent survival (A, B and C). In the EMT-6-AR1 tumor model, 70% of mice were cured with 20nm Celludo-PPT formulation (B). In the PC3 RES model, Celludo-PPT showed increased apoptosis and decreased viability compared to mice treated with free CBZ or free PPT (D). Dosage and methodology information available from the following link: https://www.ncbi.nlm.nih.gov/pmc/articles/PMC4379456/figure/F6/. Image from Roy et al. Biomaterials 2015;52:335-346. doi:10.1016/j.biomaterials.2015.02.041.
Overcoming Pgp-mediated MDR with Celludo
Podophyllotoxin (PPT) exhibited significant activity against P-glycoprotein MDR tumor cell lines; however, due to its poor solubility and high toxicity, PPT cannot be dosed systemically, preventing its clinical use for MDR cancer. (Yang et al., 2017: https://www.ncbi.nlm.nih.gov/pubmed/27873118)
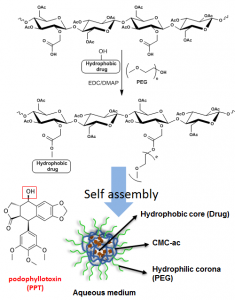
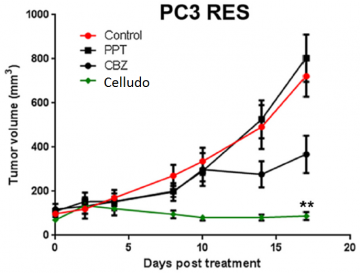
Fig 7. Celludo synthesis (left) and enhanced efficacy in treating prostate cancer demonstrated by Celludo-PPT in comparison to free PPT (right). Image from Roy et al. Biomaterials 2015;52:335-346. doi:10.1016/j.biomaterials.2015.02.041